PGSO Sync+
PGSO Sync+
  • Home
  • SITE
    • Vibration Sensors
    • Smart Metering
    • PGSO Main Company Site
  • More
    • Home
    • SITE
      • Vibration Sensors
      • Smart Metering
      • PGSO Main Company Site
  • Home
  • SITE
    • Vibration Sensors
    • Smart Metering
    • PGSO Main Company Site

Vibration Sensors

Truly making the invisible visible

Lets discuss the possibilities

 "The real advantage isn’t just finding problems early; it’s knowing when there aren’t any" 

PGSO Sync can supply, install, set up and produce your reports.

What are the benefits of vibration analysis?

Implementing vibration analysis as a predictive maintenance strategy delivers substantial advantages for industrial operations, particularly those reliant on rotating machinery such as pumps, motors, and other critical assets. 


The key benefits include:


Reduction of Unplanned Downtime:
Vibration analysis enables early detection of mechanical issues—such as looseness, imbalance, or bearing faults—before they escalate into major failures. This proactive approach helps maintenance teams prevent unexpected shutdowns, minimising production losses, costly repairs, and operational disruptions. 

Extended Asset Lifespan:
By identifying abnormal conditions at an early stage, root causes can be addressed before they result in significant damage. This reduces premature wear, extends the service life of equipment, and optimises the use of spare parts, ultimately lowering the frequency and cost of maintenance cycles. 

Data-Driven Decision Making:
Vibration analysis provides a robust technical foundation for maintenance decisions, using frequency spectra, trend graphs, and historical failure data. This evidence-based approach eliminates guesswork, supports the prioritisation of interventions, and guides investments in reliability and asset management. 

Optimised Maintenance Windows:
Maintenance activities can be scheduled based on actual equipment condition rather than fixed calendars. This alignment reduces Mean Time to Repair (MTTR), increases Mean Time Between Failures (MTBF), and improves the allocation of technical resources across the plant. 

Cost Reduction and Increased ROI:
Preventing severe failures and optimising maintenance interventions directly lowers operational costs. Vibration analysis also justifies investments in reliability with concrete data, improving the overall return on investment for maintenance programmes. 

In summary, vibration analysis transforms maintenance from a reactive to a proactive discipline, empowering organisations to make informed decisions, enhance operational efficiency, and safeguard business continuity.

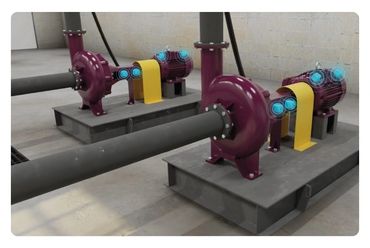
Types of assets you can use PGSO Sync+ Vibration sensors on
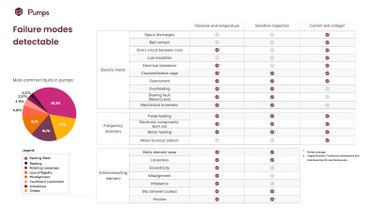
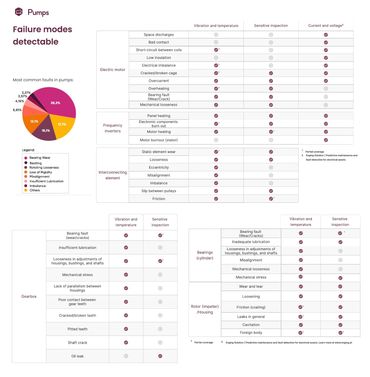
Pumps

We help businesses transform their operations and customer experiences through digital technologies. From strategy to implementation, we provide end-to-end solutions that unlock new opportunities and drive growth.

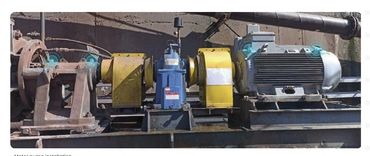
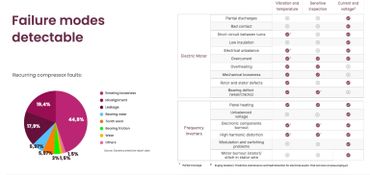
Electrical Equipment

Mobile is the future of computing, and we're experts in building beautiful and functional mobile apps. Whether you need a native app for iOS or Android, or a cross-platform app that works everywhere, we can help.

Other types of assets

Other types of assets

Migrating to the cloud can be a daunting task, but it doesn't have to be. We help businesses move their applications and data to the cloud, and manage their cloud infrastructure for optimal performance and cost savings.

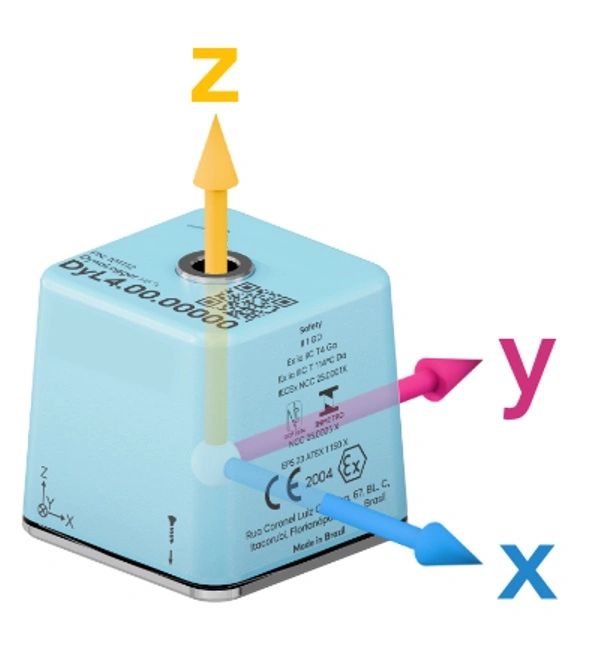
Vibration Sensor Hardware

Each sensor can be held in place using a strong magnet.  Or can be glued for a more secure fitting. 

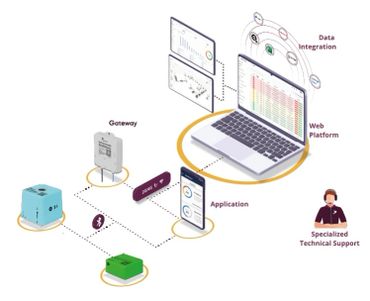
There is also a gateway that can be installed if there is a requirement for automatically pushing the data out to the cloud.

Types of readings

Temperature

Triaxials - Vibration

Every sensor in our range provides these readings

Triaxials - Vibration

Triaxials - Vibration

Every sensor in our range provides these readings


Simultaneous triaxial measurement. frequency range:

up to 2.5 kHz

Spectral up to 2.5 kHz

The Green Sensors provide Temperature, triaxial and spectral readings (Upto 2.5kHz).


Spectral up to 13 kHz

The Blue Sensors provide Temperature, triaxial and spectral readings (Upto 13kHz)
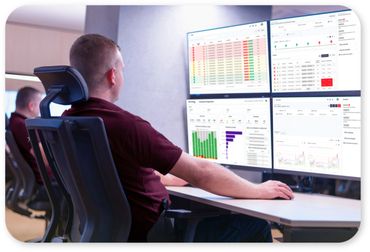
Spectral vs Non Spectral

Monitoring both the temperature and the triaxle readings helps you trend the readings.  This helps you see when something is going wrong.


The Spectral readings help find out what is wrong.

Repair or Replace

For asset, each site and each client this could be different.  But answering this help build up the best solution for you.  


Are you just going to replace the asset when it fails.

or

Is it an expensive/business critical asset that you will carry out repairs on.

Dashboard

Management Indicators

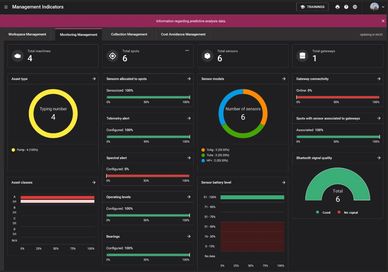
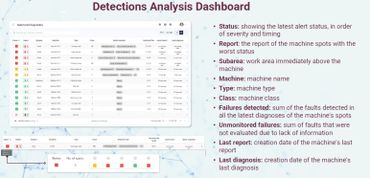
The management dashboard 

Site Setup

No matter how complex you portfolio is we can create a site structure within the dashboard to match your property portfolio.  Single site with 1 plant room to multiple sites with multiple plant rooms in each site. This helps you to visualise you site and navigate easily around it. 
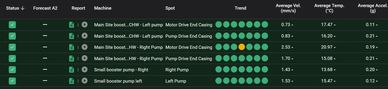
Sensor Level View

Our IT consulting services can help you optimize your IT infrastructure, improve security, and reduce costs. Our team of experts can provide recommendations tailored to your business needs.

Asset Level View

We offer a range of cybersecurity services to protect your business from cyber threats. Our services include vulnerability assessments, penetration testing, and threat intelligence.

Hours Run

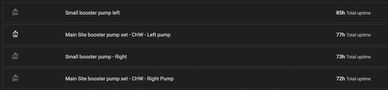
Monitor using the vibration the hours run of each asset.  If you have 2 of more of an asset working on the same system you can use this to see if you are getting equal usage across the set.  Or is one asset picking up the majority of the work.  And there for that asset will more likely fail or need repairs before the others.  
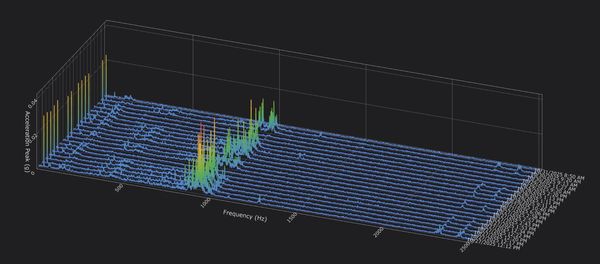
In depth Graphs

The above graph is called a water fall graph.  It shows approx 20 data readings from the same sensor over time.  This is particularly useful when monitoring maintenance tasks such as greasing for before and after.

Data & Reports

Dashboard

We can set up your site and assets to match your site and needs.  Each asset will be programmed into the system and parameters based on best practice and ISO standards for vibration will be applied.  This will then allow you to monitor the trends and take action when these increase and trigger the alerts.   

Connection to the sensor manufacture with asset monitoring

This will require the use of the gateways to push the data out to the cloud so the manufactures data scientists can monitor.  This will also require the use of the sensors with the spectral readings.  In our experience we recommend the 13kHz sensors to capture the most amount of data.

One off in-depth reports produced by the sensor manufacture

This is normally initiated when the site team notice an issue with an asset or the asset already has sensors connected to it and there is an increasing in the vibration trend.  


This requires the sensors with the spectral readings.


This can be done in 1 of 2 ways.


1 - The data is pushed out to the cloud via a gateway and a report is requested on the asset that is in question

2 - We can attend site with the portable sensor and take spectral readings of the asset and then send this to the manufacture to produce the report.

AI fault detection and recommendation system

This requires the use of gateways to push the data out to the cloud.  The blue sensor with the 13kHz readings are needed.  Also more sensors per asset are needed to gain even more data.  This data is then fed through the algorithms and monitored for faults and then recommendations are provided.   

These algorithms have been built up over many years and from the data of 500k+ sensors out in the field.  

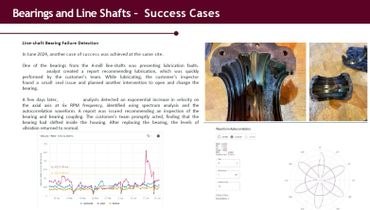
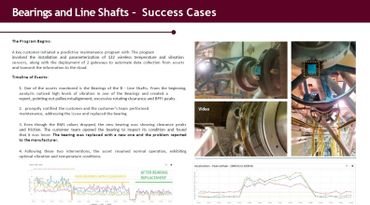
CASE STUDY - Before & After Greasing

1st Client - Good Result

The vibration waterfall graph above has 3 lines of data showing high vibration readings.  The pump is then greased and you can clearly see the big reduction in the vibration readings.

2nd Client - Poor Result

This client had did grease their pumps but it was done on an adhoc basis and the time between greasing was far too long.  In this graph there are about 7 readings before the greasing and the rest are after.  There is not much difference seen.  SO there has been some damaged caused to the bearings.

Carryout a greasing regime based on data

Grease when the pump needs it, not on a calendar prompt

Utilising the sensors monitoring the vibrations, a greasing regime can be produced from the system, sending out an instruction to grease.


Important things to remember.  You need to use the right grease for the asset.  


With the right sensors and enough data, we can also help to work out if the grease used was correct!   

Copyright © 2026 PGSO Sync+ - Part of the PGSO Group - All Rights Reserved.

This website uses cookies.

We use cookies to analyze website traffic and optimize your website experience. By accepting our use of cookies, your data will be aggregated with all other user data.

DeclineAccept